The latest index from the Office of National Statistics has revealed the changes in property values for each region of the UK in 2017.
There are positive signs for homeowners in the UK as all regions saw an increase in house prices in the 12 months leading up to November 2017.
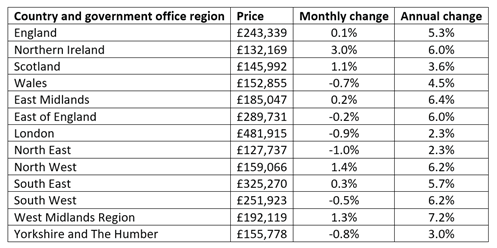
The West Midlands region saw the largest growth in the UK, with a substantial rise of 7.2% across the year, taking the average house price in the area to £192,119. Not too far behind, showing similar figures was the East Midlands region where properties saw an increase in value of 6.4% and reaching £185,047.
Joint for third place on the property price table were the North and South West regions, both showing a rise in values of 6.2% taking the average prices to £159,066 and £251,923 respectively.
When comparing the individual countries, Northern Ireland came out on top, seeing a jump in house prices by 6.0% across the year and the average price of a home now stands at £132,169.
England showed growth of 5.3% (£242,339), Wales recorded a rise of 4.5% (£152,885) and Scotland has the smallest, but still a positive change of 3.6% (£145,992).
The data also revealed just how much prices had changed depending on property type and it appears that homes more suited for first-time buyers such as semi-detached and terraced saw the largest growth with prices up 5.8% (£213,002) and 5.6% (£182,738) respectively.